Initiating Coverage | Plywood
March 03, 2018
Greenply Industries
BUY
The plywood maker for growing India
CMP
`340
Greenply Industries Ltd (GIL) manufactures plywood & allied products and medium
density fibreboards (MDF). GIL offers a portfolio of residential and commercial
Target Price
`395
products comprising plywood & block boards, MDF, wood floors, flush doors and
Investment Period
12 Month
decorative veneers. GIL offers wood floors under the brand name Green Floormax.
Currently, GIL has ~26% market share in the organized plywood industry.
Stock Info
Shifting of trend towards the organized plywood sector to propel growth: Indian
Sector
Plywood
plywood industry is estimated at `18,000cr (largely unorganised), and accounts for
Market Cap (` cr)
4,155
~75% share of revenues. With the implementation of GST, the share of organized
Net Debt (` cr)
413
players is expected to improve, which would benefit branded players like GIL. Hence,
Beta
1.0
we believe that GIL is best placed to gain market share on the back of better product
52 Week High / Low
401/255
quality, strong brands and wide distribution network. Currently, the company has
Avg. Daily Volume
57,987
~26% market share in the organized plywood industry.
Face Value (`)
1
BSE Sensex
34,047
Capacity addition in MDF segment a growth catalyst: GIL has added new MDF plant
Nifty
10,458
in Andhra Pradesh, which would increase the capacity from 1,80,000 CBM to
Reuters Code
GRPL.BO
540,000 CBM (new plant can generate revenue of `800-900cr). Total capex required
Bloomberg Code
MTLM.IN
for this MDF plant is `700cr out which the company has already spent ~`550cr till
1HFY18 and the balance would be spent by FY2019. The commercial production
Shareholding Pattern (%)
would start from 2QFY19, boosting the company’s profitability. Currently the company
Promoters
51.0
has ~30% market share in MDF.
MF / Banks / Indian Fls
20.6
Pradhan Mantri Awas Yojana (PMAY) - trigger for MDF segment: The government has
FII / NRIs / OCBs
14.9
set an aim to build ~1.2cr houses by 2022 under PMAY, which would increase the
Indian Public / Others
13.5
demand for plywood industry for making doors and furniture. Moreover, in the lower
segment, demand for MDF would increase for these houses.
Abs.(%)
3m
1yr
3yr
Strong brand visibility with wide distribution network: GIL has been continuously
Sensex
3.7
17.5
15.6
focusing on strong brand visibility. Historically, the company has been spending
GIL
8.0
18.9
85.4
around 3% (% of sales) on ad spends to increase its brand visibility. Currently, GIL’s
products (Plywood and MDF) are available across India through 30-35 branches,
which address more than 2,000 dealers and nearly 10,000 retailers.
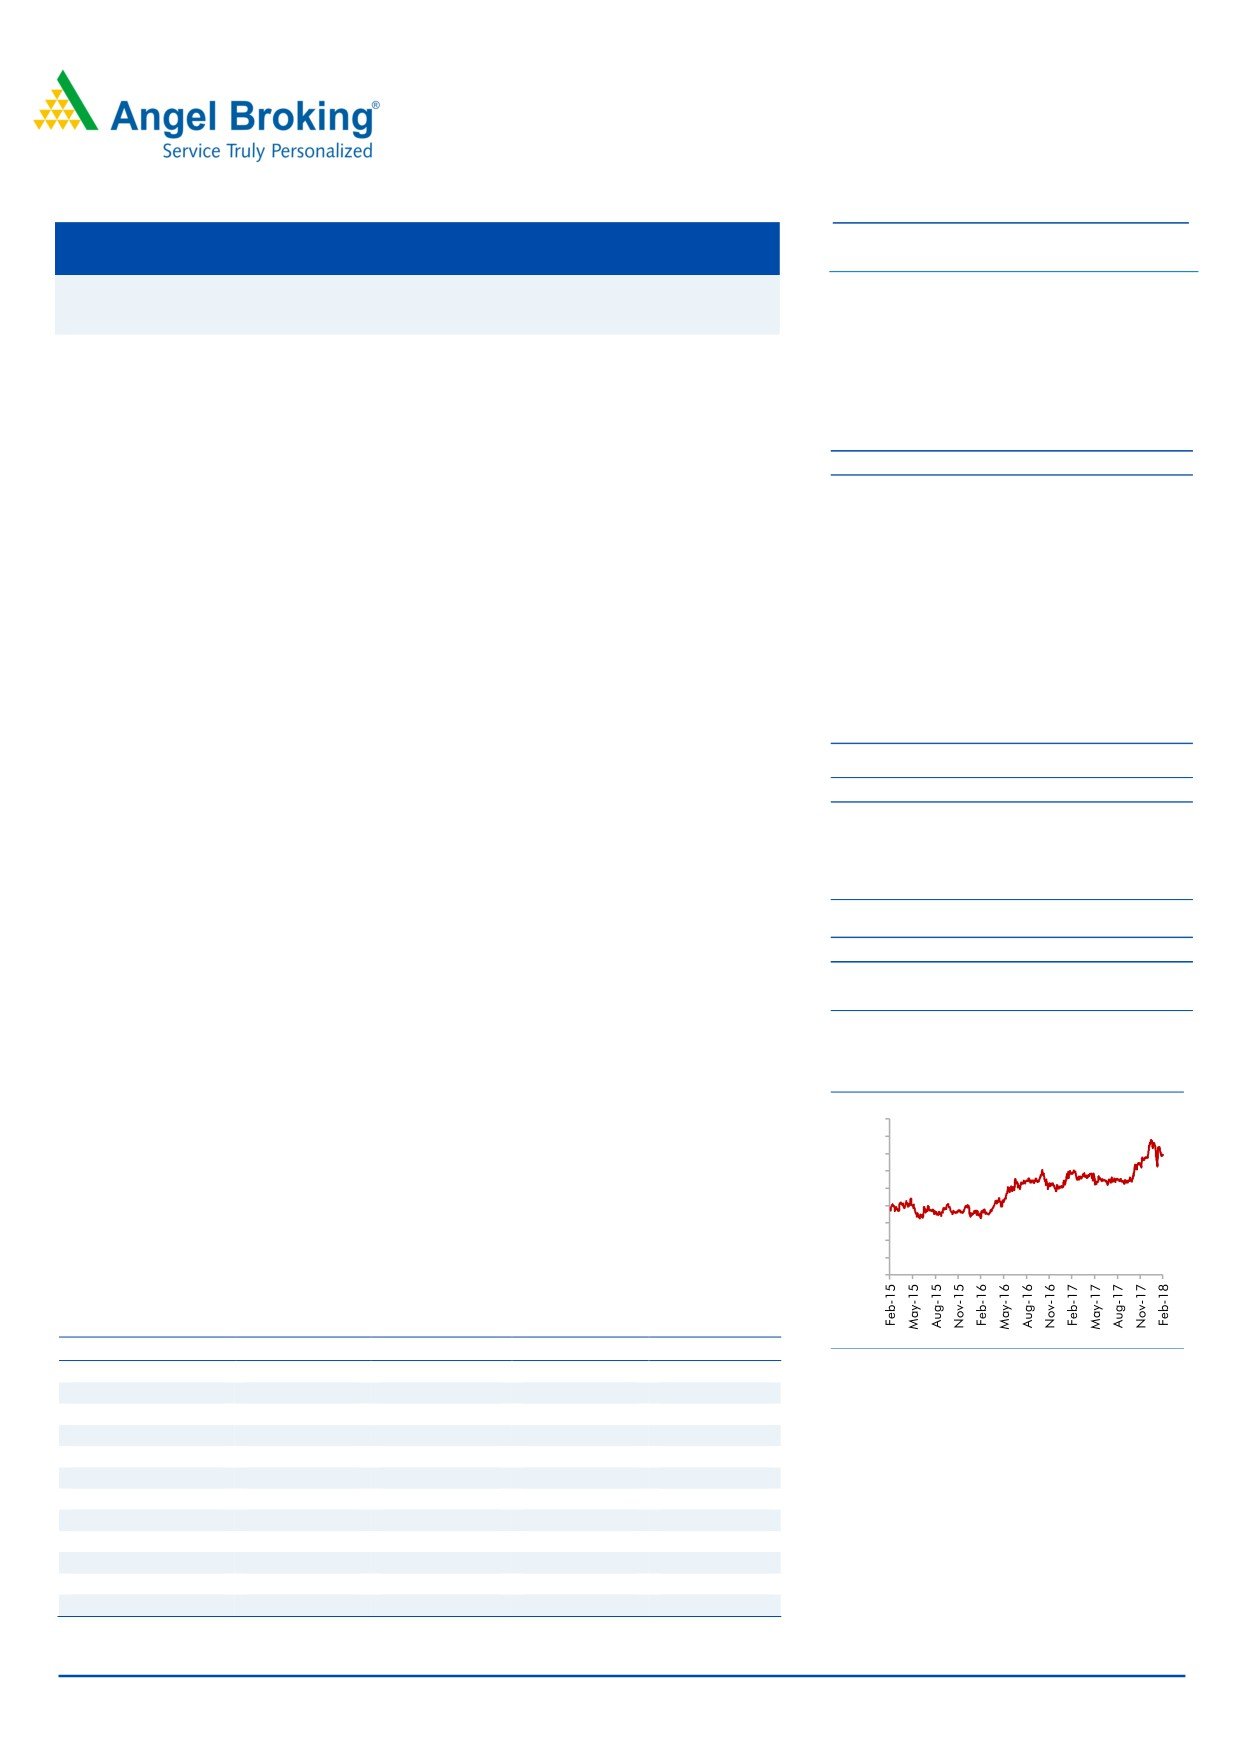
3-year price chart
Outlook and Valuation: We expect GIL to report net revenue CAGR of ~14% to
~`2,478cr over FY2017-20E mainly due to healthy growth in plywood & lamination
450
business and MDF (capacity expansion) on the back of strong brand and distribution
400
350
network. On the bottom-line front, we expect ~13% CAGR to `179cr over the same
300
period owing to strong revenue and better margins in MDF business. At the current
250
200
market price of `340, the stock trades at PE of 23.3x its FY2020E EPS of `14.6. We
150
initiate coverage on GIL with Buy recommendation and Target Price of `395 (27x
100
50
FY20E EPS), indicating an upside of ~16% from the current levels.
0
Key financials
Y/E March (` cr)
FY2017
FY2018E
FY2019E
FY2020E
Source: Company, Angel Research
Net sales
1,664
1,711
2,188
2,478
% chg
1.0
2.8
27.9
13.2
Net profit
125
135
161
179
% chg
(1.9)
7.7
19.2
11.4
EBITDA margin (%)
14.5
14.5
15.6
15.7
EPS (`)
10.2
11.0
13.1
14.6
P/E (x)
33.2
30.9
25.9
23.3
Amarjeet S Maurya
P/BV (x)
5.4
4.6
3.9
3.3
022-39357800 Ext: 6831
RoE (%)
16.2
14.9
15.1
14.4
RoCE (%)
16.3
13.6
16.6
16.3
EV/Sales (x)
2.7
2.7
2.1
1.8
EV/EBITDA (x)
18.5
18.7
13.5
11.6
Source: Company, Angel Research, Note: CMP as of March 1, 2018
Please refer to important disclosures at the end of this report
1
Greenply Industries| Initiating Coverage
Outlook and Valuation
We expect GIL to report net revenue CAGR of ~14% to ~`2,478cr over FY2017-20E
mainly due to healthy growth in plywood & lamination business and MDF (capacity
expansion) on the back of strong brand and distribution network. On the bottom-line
front, we expect ~13% CAGR to `179cr over the same period owing to strong revenue
and better margins in MDF business. At the current market price of `340, the stock
trades at PE of 23.3x its FY2020E EPS of `14.6. We initiate coverage on GIL with Buy
recommendation and Target Price of `395 (27x FY20E EPS), indicating an upside of
~16% from the current levels.
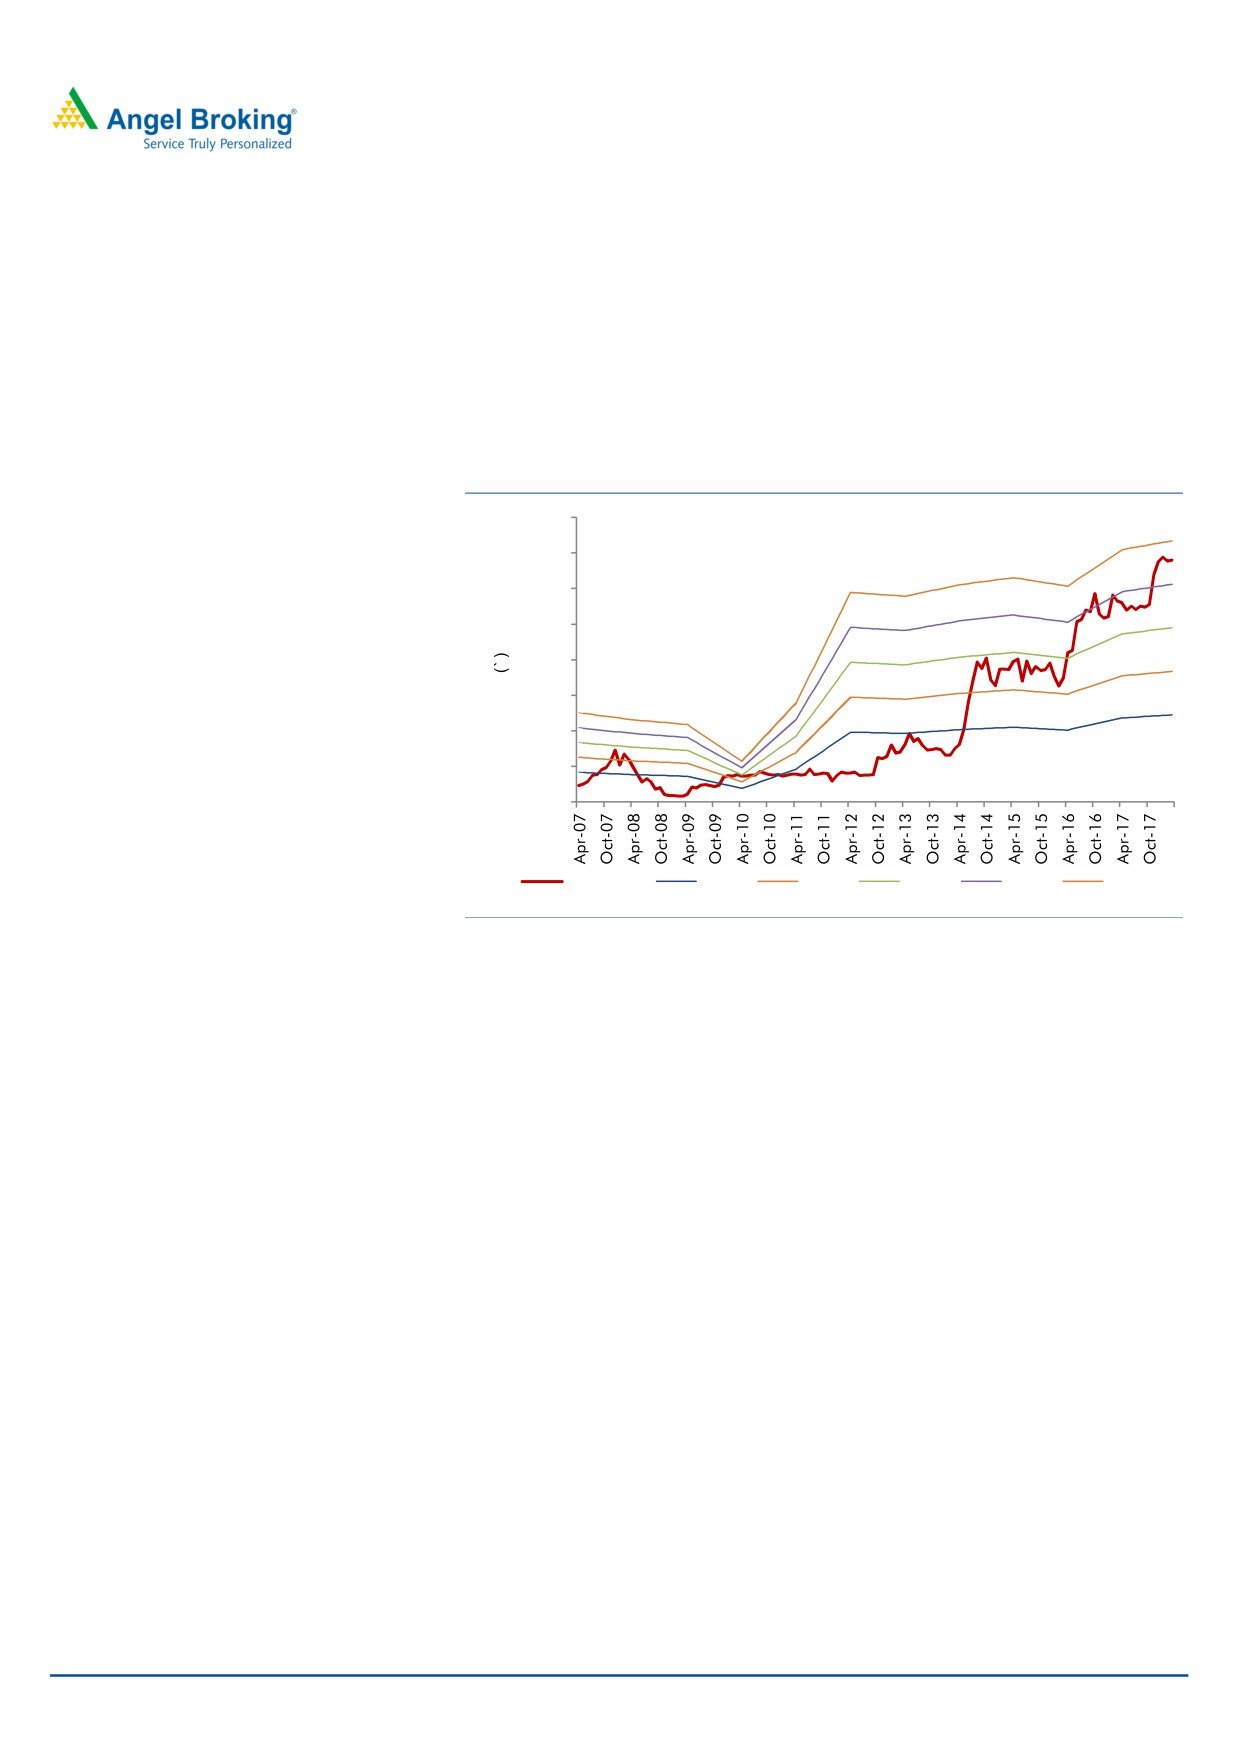
Exhibit 1: One year forward PE Chart
400
350
300
250
200
150
100
50
0
Share Price
10.0 X
15.0 X
20.0 X
25.0 X
30.0 X
Source: Company, Angel Research
Risks to our estimates
Most of the company’s raw material is imported from other countries. The
company also has ECB loan, hence any unfavorable change in currency may pose
forex risks, which could significantly impact GIL’s margins.
The company is expanding the MDF plant with capex of ~`700cr, any slowdown
in MDF market can impact the company’s earnings due higher fixed cost
overheads.
March 03, 2018
2
Greenply Industries| Initiating Coverage
Company Background
Greenply Industries Limited is engaged in the business of manufacturing plywood &
allied products and medium density fibreboards (MDF) through its factories at various
locations. The company's segments include Plywood & Allied Products and Medium
Density Fibre Boards & Allied Products. The Plywood & Allied Products segment is
engaged in the business of manufacturing and trading of Plywood, block boards,
veneer, doors and other wood panel products through its wholesale and retail network.
The Medium Density Fibre Boards & Allied Products segment is engaged in the business
of manufacturing of Medium Density Fibreboards and other allied products through its
wholesale and retail network. The company offers a portfolio of residential and
commercial products comprising plywood and block boards, MDF, wood floors, flush
doors and decorative veneers. The company offers wood floors under the brand name
Green Floormax.
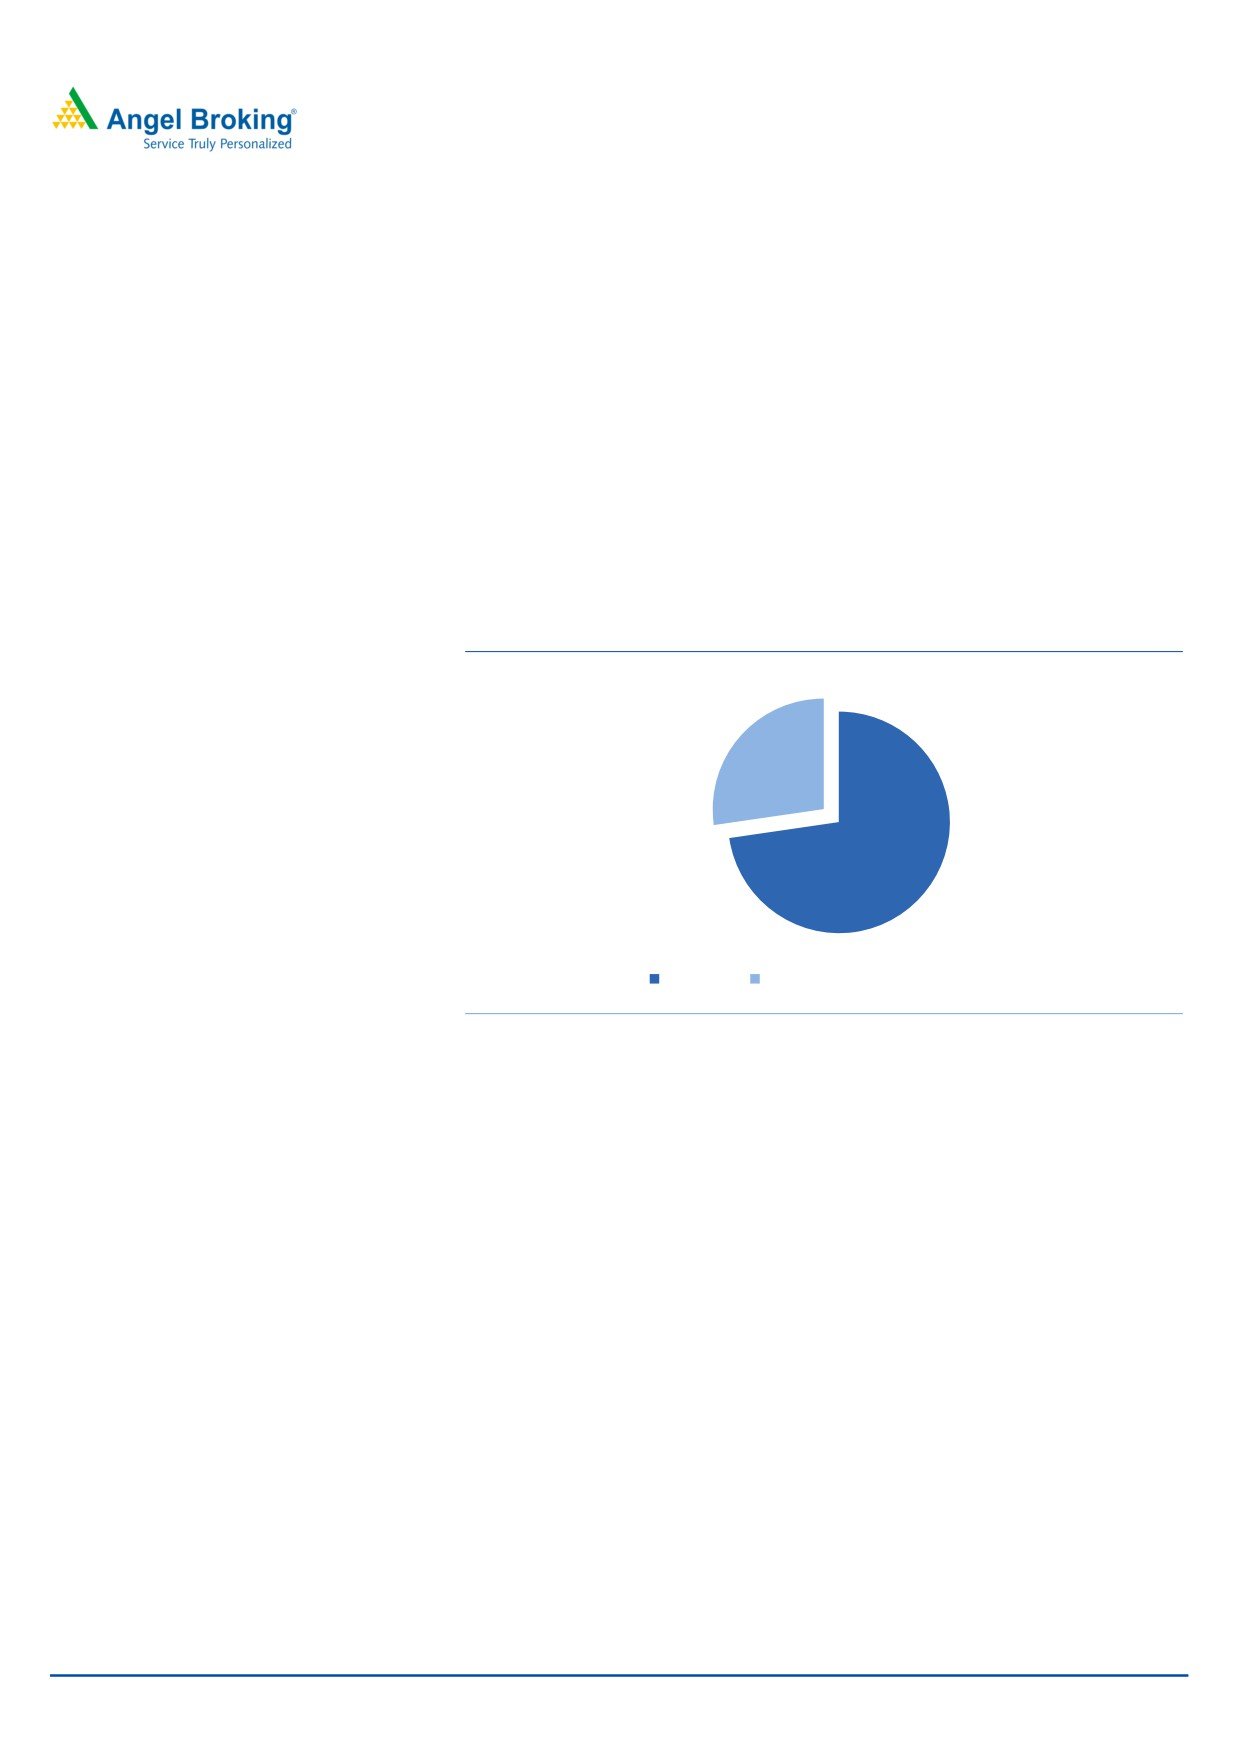
Exhibit 2: Revenue break-up for FY2017
27%
73%
Plywood
Medium Density Fireboard (MDF)
Source: Company, Angel Research
March 03, 2018
3
Greenply Industries| Initiating Coverage
Consolidated Profit & Loss Statement
Y/E March (` cr)
FY2015
FY2016
FY2017
FY2018E
FY2019E
FY2020E
Total operating income
1,564
1,647
1,664
1,711
2,188
2,478
% chg
(29.4)
5.3
1.0
2.8
27.9
13.2
Total Expenditure
1,359
1,409
1,423
1,463
1,847
2,089
Raw Material
909
920
883
907
1,160
1,313
Personnel
145
167
177
183
239
273
Others Expenses
305
321
362
373
449
503
EBITDA
205
239
241
248
341
389
% chg
(22.6)
16.6
0.9
3.0
37.6
13.9
(% of Net Sales)
13.1
14.5
14.5
14.5
15.6
15.7
Depreciation& Amortisation
47
50
51
52
75
98
EBIT
158
189
190
196
266
291
% chg
(23.0)
19.9
0.6
3.0
35.8
9.2
(% of Net Sales)
10.1
11.5
11.4
11.5
12.2
11.7
Interest & other Charges
36
29
19
13
43
43
Other Income
19
10
10
10
10
12
(% of PBT)
13.7
5.9
5.5
5.2
4.3
4.6
Share in profit of Associates
-
-
-
-
-
-
Recurring PBT
141
170
181
193
233
260
% chg
(7.6)
20.2
6.9
6.4
20.9
11.4
Tax
17
41
56
58
72
81
(% of PBT)
12.0
24.4
30.8
30.0
31.0
31.0
PAT (reported)
124
128
125
135
161
179
% chg
5.7
3.0
(1.9)
7.7
19.2
11.4
(% of Net Sales)
7.9
7.8
7.5
7.9
7.4
7.2
Basic EPS (`)
10.1
10.4
10.2
11.0
13.1
14.6
Fully Diluted EPS (`)
10.1
10.4
10.2
11.0
13.1
14.6
% chg
5.7
3.0
(1.9)
7.7
19.2
11.4
Source: Company, Angel Research
March 03, 2018
4
Greenply Industries| Initiating Coverage
Consolidated Balance Sheet
Y/E March (` cr)
FY2015
FY2016
FY2017
FY2018E
FY2019E
FY2020E
SOURCES OF FUNDS
Equity Share Capital
12
12
12
12
12
12
Reserves& Surplus
474
602
760
895
1,056
1,236
Shareholders Funds
486
614
773
908
1,069
1,248
Minority Interest
-
-
-
-
-
-
Total Loans
332
270
397
536
536
536
Deferred Tax Liability
49
50
49
49
49
49
Total Liabilities
867
935
1,218
1,493
1,654
1,833
APPLICATION OF FUNDS
Gross Block
726
774
797
807
1,507
1,517
Less: Acc. Depreciation
193
232
272
324
399
497
Net Block
533
542
526
484
1,109
1,020
Capital Work-in-Progress
14
9
269
620
-
-
Investments
35
29
26
26
26
26
Current Assets
567
620
757
739
1,006
1,315
Inventories
190
139
158
173
228
285
Sundry Debtors
257
333
302
319
420
496
Cash
8
35
78
41
85
163
Loans & Advances
97
74
66
68
98
136
Other Assets
15
40
153
137
175
235
Current liabilities
291
316
395
410
522
563
Net Current Assets
276
304
363
328
484
752
Deferred Tax Asset
9
50
35
35
35
35
Mis. Exp. not written off
-
-
-
-
-
-
Total Assets
867
935
1,218
1,493
1,654
1,833
Source: Company, Angel Research
March 03, 2018
5
Greenply Industries| Initiating Coverage
Consolidated Cashflow Statement
Y/E March (` cr)
FY2015 FY2016 FY2017 FY2018E FY2019E FY2020E
Profit before tax
141
170
181
193
233
260
Depreciation
47
50
51
52
75
98
Change in Working Capital
(9)
(21)
(25)
(2)
(112)
(190)
Interest / Dividend (Net)
35
28
18
13
43
43
Direct taxes paid
(28)
(38)
(42)
(58)
(72)
(81)
Others
1
2
(0)
0
0
0
Cash Flow from Operations
187
191
183
198
167
131
(Inc.)/ Dec. in Fixed Assets
(86)
(69)
(295)
(10)
0
(10)
(Inc.)/ Dec. in Investments
(19)
6
2
(345)
(80)
0
Cash Flow from Investing
(105)
(63)
(293)
(355)
(80)
(10)
Issue of Equity
0
0
50
0
0
0
Inc./(Dec.) in loans
(47)
(64)
129
139
0
0
Dividend Paid (Incl. Tax)
(7)
(7)
(7)
0
0
0
Interest / Dividend (Net)
(29)
(29)
(22)
(13)
(43)
(43)
Cash Flow from Financing
(82)
(100)
150
126
(43)
(43)
Inc./(Dec.) in Cash
1
28
40
(30)
44
78
Opening Cash balances
3
3
31
71
41
85
Closing Cash balances
3
31
71
41
85
163
Source: Company, Angel Research
March 03, 2018
6
Greenply Industries| Initiating Coverage
Key ratios
Y/E March
FY2015 FY2016 FY2017FY2018EFY2019EFY2020E
Valuation Ratio (x)
P/E (on FDEPS)
33.6
32.6
33.2
30.9
25.9
23.3
P/CEPS
24.3
23.4
23.7
22.3
17.7
15.0
P/BV
8.6
6.8
5.4
4.6
3.9
3.3
Dividend yield (%)
0.2
0.0
20.6
0.0
0.0
0.0
EV/Sales
2.8
2.7
2.7
2.7
2.1
1.8
EV/EBITDA
21.8
18.3
18.5
18.7
13.5
11.6
EV / Total Assets
5.1
4.7
3.7
3.1
2.8
2.5
Per Share Data (Rs)
EPS (Basic)
10.1
10.4
10.2
11.0
13.1
14.6
EPS (fully diluted)
10.1
10.4
10.2
11.0
13.1
14.6
Cash EPS
14.0
14.5
14.4
15.3
19.3
22.6
DPS
0.6
0.0
70.0
0.0
0.0
0.0
Book Value
39.7
50.1
63.0
74.0
87.2
101.8
Returns (%)
ROCE
19.3
21.4
16.3
13.6
16.6
16.3
Angel ROIC (Pre-tax)
20.4
23.0
17.9
14.2
17.8
18.2
ROE
25.5
20.8
16.2
14.9
15.1
14.4
Turnover ratios (x)
Asset Turnover (Gross Block)
2.2
2.1
2.1
2.1
1.5
1.6
Inventory / Sales (days)
44
31
35
37
38
42
Receivables (days)
60
74
66
68
70
73
Payables (days)
53
55
66
66
66
64
Working capital cycle (ex-cash) (days)
51
49
35
39
42
51
Source: Company, Angel Research
March 03, 2018
7
Greenply Industries| Initiating Coverage
Research Team Tel: 022 - 39357800
DISCLAIMER
Angel Broking Private Limited (hereinafter referred to as “Angel”) is a registered Member of National Stock Exchange of India Limited,
Bombay Stock Exchange Limited and Metropolitan Stock Exchange Limited. It is also registered as a Depository Participant with CDSL
and Portfolio Manager with SEBI. It also has registration with AMFI as a Mutual Fund Distributor. Angel Broking Private Limited is a
registered entity with SEBI for Research Analyst in terms of SEBI (Research Analyst) Regulations, 2014 vide registration number
INH000000164. Angel or its associates has not been debarred/ suspended by SEBI or any other regulatory authority for accessing
/dealing in securities Market. Angel or its associates/analyst has not received any compensation / managed or co-managed public
offering of securities of the company covered by Analyst during the past twelve months.
This document is solely for the personal information of the recipient, and must not be singularly used as the basis of any investment
decision. Nothing in this document should be construed as investment or financial advice. Each recipient of this document should
make such investigations as they deem necessary to arrive at an independent evaluation of an investment in the securities of the
companies referred to in this document (including the merits and risks involved), and should consult their own advisors to determine
the merits and risks of such an investment.
Reports based on technical and derivative analysis center on studying charts of a stock's price movement, outstanding positions and
trading volume, as opposed to focusing on a company's fundamentals and, as such, may not match with a report on a company's
fundamentals. Investors are advised to refer the Fundamental and Technical Research Reports available on our website to evaluate the
contrary view, if any.
The information in this document has been printed on the basis of publicly available information, internal data and other reliable
sources believed to be true, but we do not represent that it is accurate or complete and it should not be relied on as such, as this
document is for general guidance only. Angel Broking Pvt. Limited or any of its affiliates/ group companies shall not be in any way
responsible for any loss or damage that may arise to any person from any inadvertent error in the information contained in this report.
Angel Broking Pvt. Limited has not independently verified all the information contained within this document. Accordingly, we cannot
testify, nor make any representation or warranty, express or implied, to the accuracy, contents or data contained within this document.
While Angel Broking Pvt. Limited endeavors to update on a reasonable basis the information discussed in this material, there may be
regulatory, compliance, or other reasons that prevent us from doing so.
This document is being supplied to you solely for your information, and its contents, information or data may not be reproduced,
redistributed or passed on, directly or indirectly.
Neither Angel Broking Pvt. Limited, nor its directors, employees or affiliates shall be liable for any loss or damage that may arise from
or in connection with the use of this information.
Disclosure of Interest Statement
Greenply Industries
1. Financial interest of research analyst or Angel or his Associate or his relative
No
2. Ownership of 1% or more of the stock by research analyst or Angel or associates or relatives
No
3. Served as an officer, director or employee of the company covered under Research
No
4. Broking relationship with company covered under Research
No
Ratings (Based on expected returns
Buy (> 15%)
Accumulate (5% to 15%)
Neutral (-5 to 5%)
over 12 months investment period):
Reduce (-5% to -15%)
Sell (< -15)
March 03, 2018
8